Vortex: An Event-Driven Threat Intelligence & Security Investigation Platform in Go
open-source, high-throughput security pipeline with Hexagonal Architecture, explainable risk scoring, and DevSecOps principles.
 Zoom
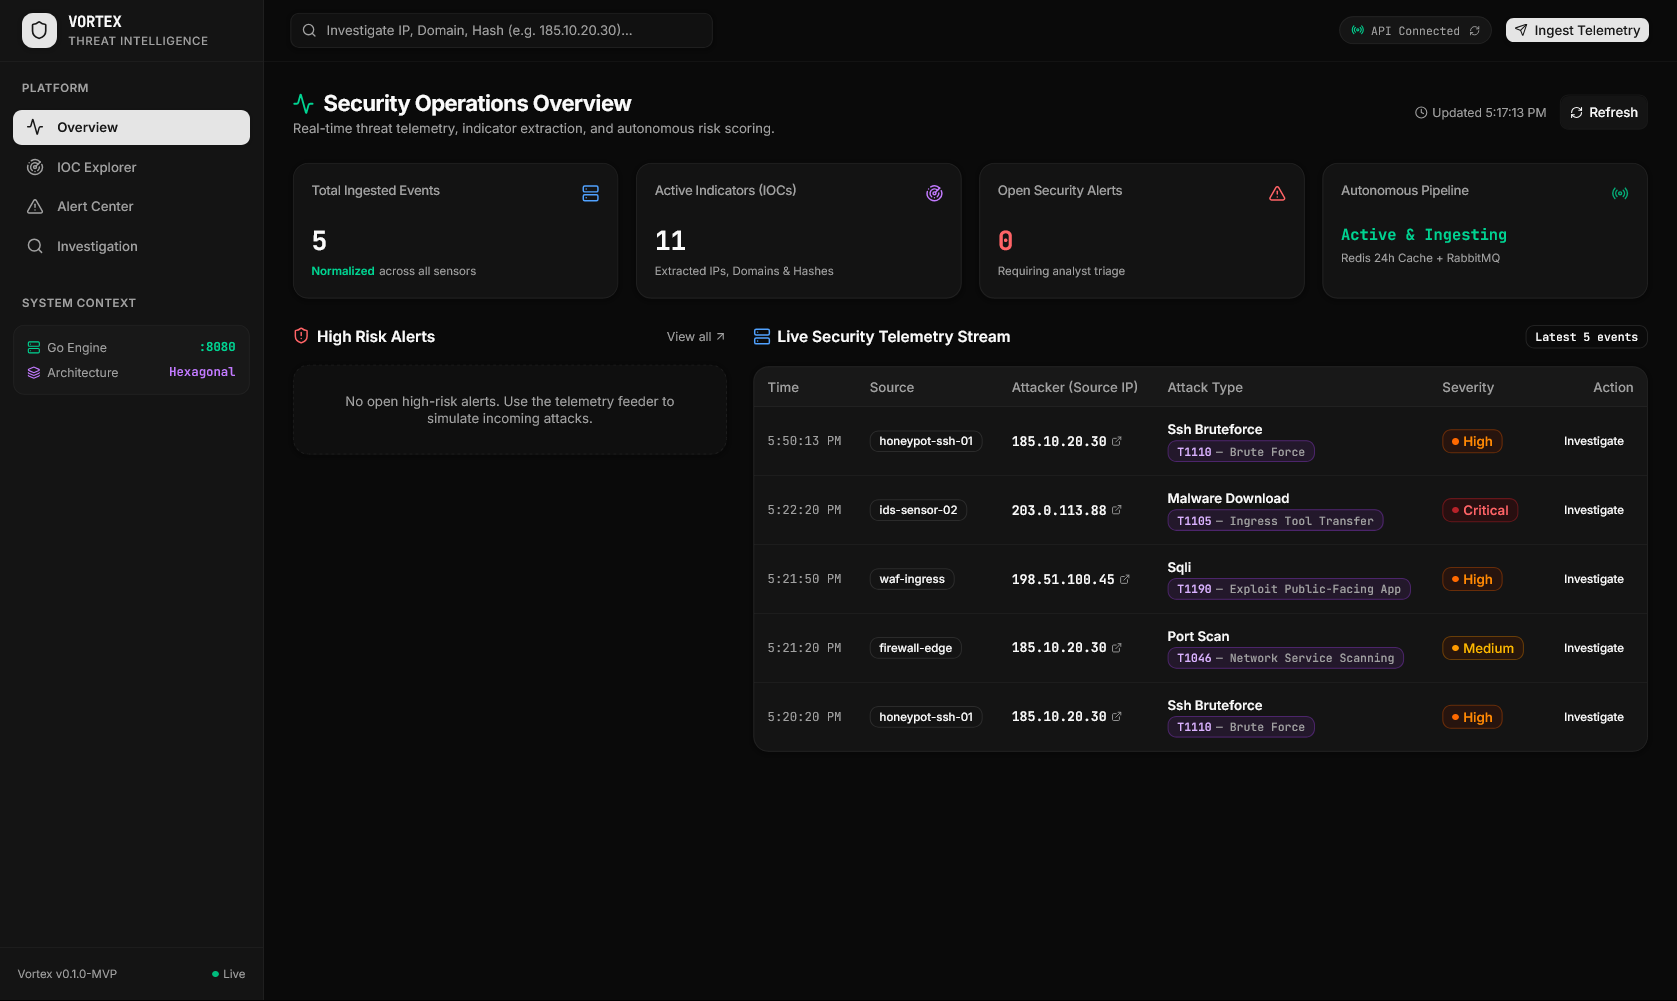
Vortex — Open-source, high-throughput threat intelligence and security investigation platform.
Zoom
Vortex — Open-source, high-throughput threat intelligence and security investigation platform.
The Threat Telemetry Bottleneck: Why I Built Vortex
In modern Security Operations Centers (SOCs) and cloud-native environments, security analysts face an overwhelming torrent of data. Honeypots, Web Application Firewalls (WAFs), Intrusion Detection Systems (IDS), and host telemetry generate tens of thousands of raw logs per minute.
Yet, data volume without context is just noise. Analysts are often trapped in two extremes:
- Black-box legacy SIEMs that trigger cryptic alerts without explainable scoring.
- Fragmented, script-heavy parsers that choke under high throughput and leave Indicators of Compromise (IOCs) isolated from external threat intelligence.
As an engineer pursuing a career as a Secure Go Backend Engineer and DevSecOps Practitioner, I wanted to build a production-grade solution to this problem. I designed and implemented Vortex — a lightweight, distributed threat intelligence and investigation platform built with Go (1.23+), PostgreSQL 17, Redis 8, RabbitMQ 3.13, and Next.js 16.
In this article, I’ll take you under the hood of Vortex: its Hexagonal Architecture, concurrency patterns, defensive Go engineering, explainable 5-factor risk scoring engine, and how DevSecOps principles were baked in from Day 0.
🏗️ System Architecture: Decoupling with Hexagonal Design
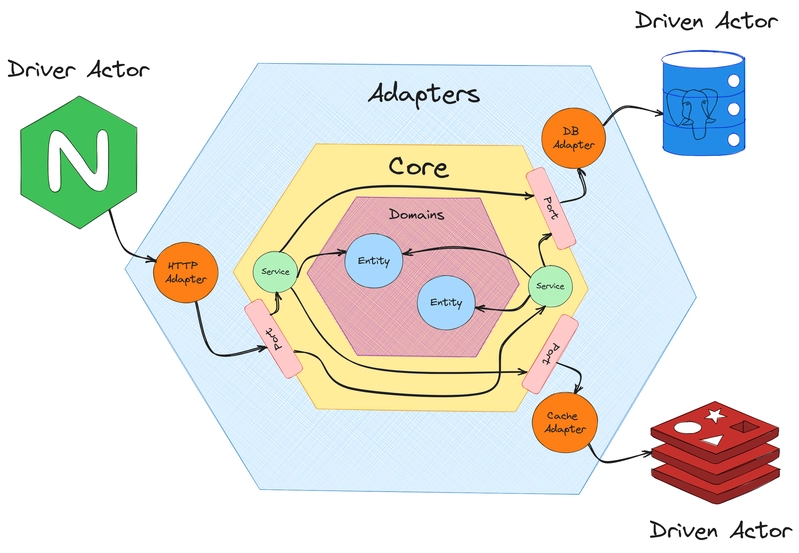
When designing high-throughput cybersecurity tooling, domain rules (detection heuristics, risk math, indicator extraction) must never be tightly coupled to storage engines or network protocols.
To achieve this, Vortex uses Hexagonal Architecture (Ports and Adapters):
INBOUND (Driving) CORE OUTBOUND (Driven)
┌───────────────────────────┐ ┌──────────────────────┐ ┌───────────────────────────┐
│ │ │ │ │ │
│ • Gin REST API Handlers │ ---> │ [Primary Ports] │ │ • PostgreSQL Adapter │
HTTP ──> │ (internal/adapter/ │ │ - IngestionService │ │ (sqlc + pgx/v5) │
│ handler/http) │ │ - QueryService │ │ │
│ │ │ │ │ • Redis Adapter │
├───────────────────────────┤ │ [Domain & Services] │ ---> │ (24h Caching) │
│ │ │ - Detection Rules │ │ │
RabbitMQ │ • Queue Consumer Handler │ ---> │ - Risk Scoring │ │ • RabbitMQ Adapter │
───> │ (cmd/worker) │ │ - IOC Extractor │ │ (Persistent Pub/Sub) │
│ │ │ - Correlation │ │ │
│ │ │ │ │ • External TI Adapters │
└───────────────────────────┘ │ [Secondary Ports] │ │ (GeoIP, VirusTotal) │
│ - Repositories │ │ │
│ - Cache / Broker │ └───────────────────────────┘
└──────────────────────┘ Zoom
Hexagonal Architecture isolating pure domain logic from transport protocols and third-party APIs.
Zoom
Hexagonal Architecture isolating pure domain logic from transport protocols and third-party APIs.
Why Hexagonal Architecture Matters for Security Systems:
- Testability: Pure domain detection logic can be tested with 100% in-memory mocks without standing up PostgreSQL or RabbitMQ instances.
- Interchangeability: Swapping out external intelligence providers (e.g., replacing Free GeoIP with MaxMind DB or adding AlienVault OTX alongside VirusTotal) requires writing a new adapter without touching core business logic.
- Resilience: Inbound ingestion through Gin and asynchronous worker processing through RabbitMQ share the exact same core domain services.
The Event-Driven Pipeline: Ingestion to Autonomous Alerting
Every security event ingested into Vortex passes through a real-time, 4-stage pipeline:
1. Raw Security Telemetry (Honeypot, WAF, IDS, Syslog)
2. Ingestion & Normalization ─► PostgreSQL + RabbitMQ
3. Distributed Worker Pipeline
- IOC Extraction (Regex/CIDR/Hash validation across payload & headers)
- Detection Engine & MITRE ATT&CK Mapping (T1110, T1046, T1190, T1105)
- External Threat Intelligence (GeoIP + VirusTotal v3)
- Redis 24h Intelligence Caching (Rate-limit mitigation)
- Graph Correlation (IP ↔ Domain ↔ File Hash)
- 5-Factor Risk & Confidence Scoring (0 – 100)
4. Autonomous Alert Engine ─► Dispatches Alert if Risk Score ≥ 70
5. SOC Analyst Web Dashboard ─► Real-time Triage & Investigation View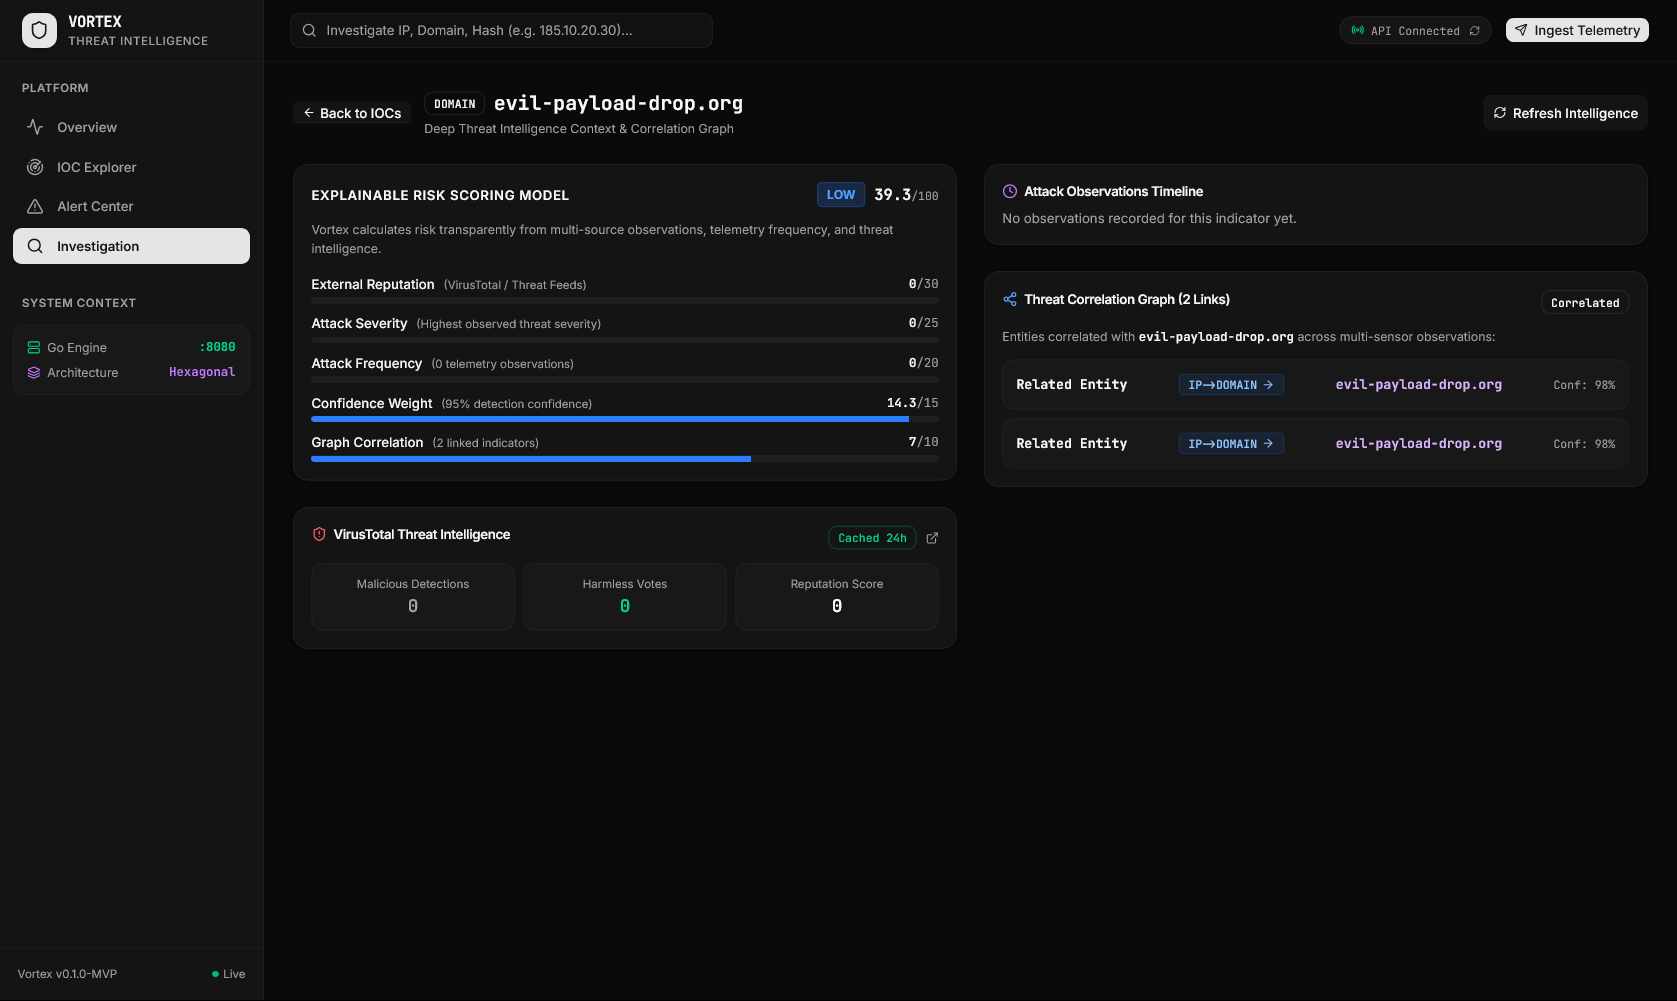 Zoom
End-to-end data flow from raw telemetry ingestion to automated risk scoring and alerting.
Zoom
End-to-end data flow from raw telemetry ingestion to automated risk scoring and alerting.
Secure Go Backend Engineering Practices
As an aspiring secure backend engineer, I implemented several defensive patterns in Go to ensure memory safety, injection resistance, and fault tolerance:
1. Eliminating SQL Injection with Type-Safe Code Generation (sqlc + pgx/v5)
Vortex completely avoids runtime string interpolation and reflection-heavy ORMs for database operations. We write standard SQL schema definitions and parameterized queries, compiling them into type-safe Go structs using sqlc:
-- db/queries/indicators.sql
-- name: UpsertIndicator :one
INSERT INTO indicators (id, type, value, first_seen, last_seen, risk_score, confidence, status)
VALUES ($1, $2, $3, $4, $5, $6, $7, $8)
ON CONFLICT (type, value) DO UPDATE
SET last_seen = EXCLUDED.last_seen,
    updated_at = NOW()
RETURNING *;
This guarantees compile-time verification of SQL queries, zero SQL injection surface, and native connection pooling performance via pgx/v5.
2. Defensive Network Validation & Payload Extraction
When parsing user-supplied security telemetry, Vortex performs rigorous regex and CIDR verification to prevent malformed data propagation and SSRF-style poisoning:
// internal/core/service/extractor.go
func (s *ExtractorService) ExtractIndicators(ctx context.Context, event *domain.Event) ([]*domain.Indicator, error) {
    if event == nil {
        return nil, domain.ErrInvalidInput
    }

    extracted := make(map[string]*domain.Indicator)

    addIndicator := func(indType domain.IndicatorType, value string) {
        value = strings.TrimSpace(value)
        if value == "" {
            return
        }
        if indType == domain.IndicatorTypeIP {
            if !util.IsValidIP(value) {
                return
            }
            if s.filterPrivateIPs && util.IsPrivateOrLoopbackIP(value) {
                return
            }
        }

        key := string(indType) + ":" + strings.ToLower(value)
        if _, exists := extracted[key]; !exists {
            extracted[key] = &domain.Indicator{
                ID:         uuid.New(),
                Type:       indType,
                Value:      value,
                FirstSeen:  time.Now().UTC(),
                LastSeen:   time.Now().UTC(),
                Status:     domain.IndicatorStatusActive,
            }
        }
    }

    // ...

    return result, nil
}
3. Graceful Shutdown & Controlled Concurrency
Both the REST API server (cmd/api) and the background worker daemon (cmd/worker) handle SIGINT and SIGTERM signals, ensuring in-flight transactions and message ACKs finish cleanly without data corruption:
quit := make(chan os.Signal, 1)
signal.Notify(quit, syscall.SIGINT, syscall.SIGTERM)
<-quit

log.Println("[Worker] Shutting down worker daemon...")
cancel()
time.Sleep(1 * time.Second)
log.Println("[Worker] Worker exited cleanly.")
4. Cache-First Intelligence Enrichment with Quota Protection
External APIs like VirusTotal impose strict rate limits. Vortex uses Redis 8 as a 24-hour cache layer. If an IP or file hash has been queried within the last 24 hours, the cached enrichment is returned immediately, saving upstream API quotas and maintaining sub-millisecond worker throughput.
Detection Heuristics & MITRE ATT&CK Mapping
Vortex correlates raw telemetry against known attack patterns, automatically tagging detected threats with MITRE ATT&CK Enterprise Matrix technique IDs:
| Attack Vector | Rule Trigger | MITRE ATT&CK | Default Severity |
|---|---|---|---|
| SSH Brute Force | Destination Port 22 + Failed auth tokens | T1110 | 🔴 High |
| Port Scanning | Multi-port probe patterns (SYN sweep) | T1046 | 🟡 Medium |
| SQL Injection | UNION SELECT, SLEEP(), INFORMATION_SCHEMA | T1190 | 🔴 High |
| Cross-Site Scripting (XSS) | <script>, onerror=, javascript: payloads | T1059.007 | 🟡 Medium |
| Path Traversal | ../../, /etc/passwd, win.ini | T1083 | 🟡 Medium |
| Malware Payload Download | Known malicious file hash + remote URI | T1105 | 🔴 Critical |
Explainable 5-Factor Risk Scoring Engine
Many security platforms output an opaque risk score (e.g. "Risk: 85") without providing the mathematical justification. When a triage analyst asks "Why is this IP marked Critical?", the platform should give a clear, auditable breakdown.
Vortex implements an Explainable 5-Factor Risk Model (0 – 100 scale):
Risk Score = Reputation (0–30) + Severity (0–25) + Frequency (0–20) + Confidence (0–15) + Correlation (0–10)// internal/core/service/risk.go
func (s *RiskScoringService) CalculateRisk(
ctx context.Context,
indicator *domain.Indicator,
observations []*domain.Observation,
enrichments []*domain.Enrichment,
relationships []*domain.Relationship,
) (*domain.RiskScore, error) {
breakdown := domain.RiskBreakdown{}
// 1. External Reputation (0 - 30) via VirusTotal
// 2. Attack Severity (0 - 25) based on highest observed threat
// 3. Observation Frequency (0 - 20) based on repeated encounters
// 4. Observation Confidence (0 - 15) weighted average
// 5. Threat Correlation (0 - 10) graph interconnectedness
total := breakdown.Reputation + breakdown.Severity +
breakdown.Frequency + breakdown.Confidence + breakdown.Correlation
if total > 100.0 {
total = 100.0
}
return &domain.RiskScore{
TotalScore: math.Round(total*10) / 10,
Level: domain.CalculateRiskLevel(total),
Breakdown: breakdown,
}, nil
}If an indicator's score reaches ≥ 70, Vortex's Alert Service automatically triggers an actionable high-severity alert for immediate SOC triage.
The Analyst Experience: Real-Time SOC Workspace
A backend engine is only as effective as the analyst's ability to interpret its findings. I built a modern, dark-mode SOC dashboard using Next.js 16 (App Router), React 19, Tailwind CSS v4, and shadcn/ui.
1. Operations Overview & Live Telemetry Stream
Provides real-time visibility into active IOC counts, open security alerts, and streaming sensor telemetry.
Zoom
Security Operations Overview with live metrics, high-risk alert stream, and normalized telemetry feed.
2. Deep Investigation & Threat Correlation Graph
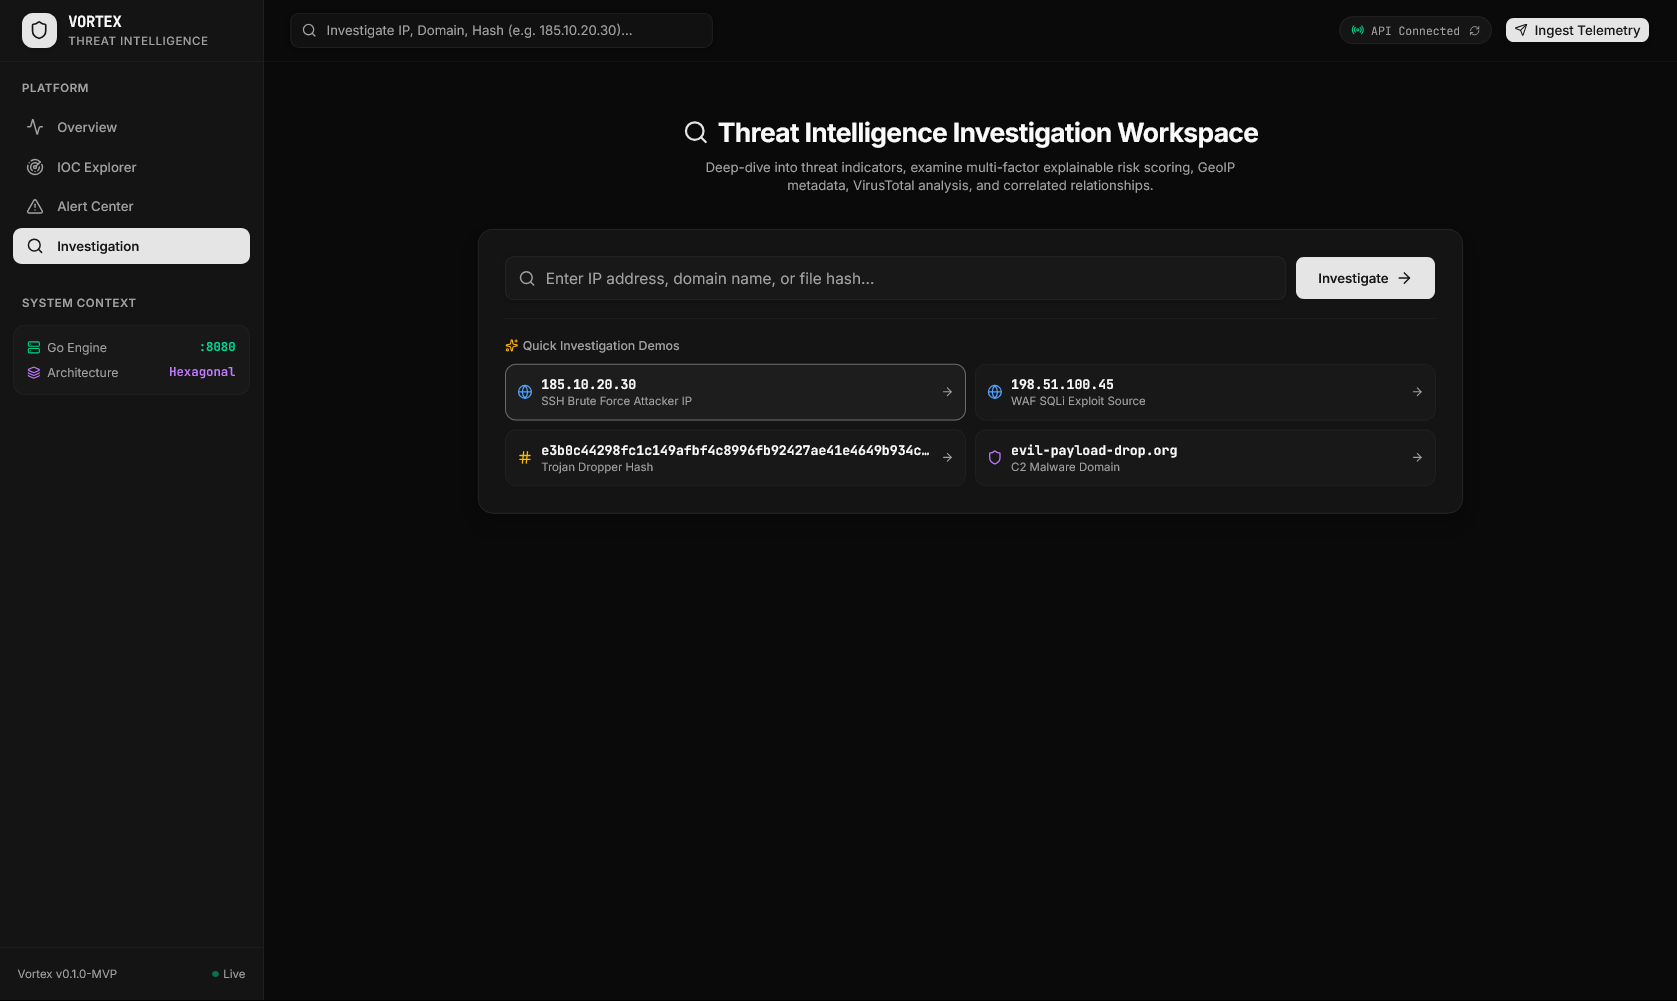
When an analyst clicks on an indicator (e.g., 185.10.20.30), Vortex generates a comprehensive dossier containing:
- GeoIP & ASN Context: Origin country, ISP, coordinates.
- External Intel Analysis: VirusTotal community reputation & malicious engine detection ratio.
- Temporal Timeline: Chronological trail of observed attack techniques.
- Threat Graph Relationships: Direct visual mapping linking the attacker's IP to observed attack domains and dropped malware hashes.
 Zoom
Zoom
Deep Investigation view showing GeoIP context, VirusTotal detection breakdown, and interconnected graph nodes.
Zoom
Zoom
Deep Investigation view showing GeoIP context, VirusTotal detection breakdown, and interconnected graph nodes.
DevSecOps & Production Engineering
Embedding security into the software delivery lifecycle (DevSecOps) was a foundational objective for Vortex.
1. Static Application Security Testing (SAST) & Linting
Every commit and pull request runs automated security checks:
gosec: Inspects Go AST for unhandled errors, weak cryptography, integer overflows, and unsafe memory blocks.golangci-lint: Enforces strict code standards, concurrency lock inspections, and dead code removal.trivy: Scans container images for known Common Vulnerabilities and Exposures (CVEs).
2. Hardened Multi-Stage Containerization
Production Docker containers follow minimal-privilege best practices:
- Built on top of minimal
alpinebase images. - Unprivileged runtime user (
nonroot:nonroot) to prevent container escape escalations. - Health checks integrated via
rabbitmq-diagnostics pingand Postgres health probes.
3. Taskfile Automation
To streamline local development and CI execution, a standardized Taskfile.yml manages lifecycle tasks:
version: '3'
dotenv: ['.env']

tasks:
  compose:up:
    desc: "Start PostgreSQL, Redis, and RabbitMQ containers"
    cmd: docker compose up -d

  run:worker:
    desc: "Run background TI processing worker"
    cmd: go run ./cmd/worker

  run:api:
    desc: "Run Gin REST API server"
    cmd: go run ./cmd/api

  run:collector:
    desc: "Simulate multi-vector attack telemetry"
    cmd: go run ./cmd/collector -scenario=all
Real-World Simulation: Putting Vortex to the Test
To validate the platform under realistic attack conditions, I built an automated attack simulator CLI (cmd/collector). Running:
go run ./cmd/collector -scenario=allDispatches multi-stage attack telemetry across four attack scenarios:
- SSH Brute Force: Repeated failed logins against port 22 from
185.10.20.30. - Port Scan: Reconnaissance sweep across open service ports.
- SQL Injection: Exploitation attempt via
UNION SELECTagainst an authentication endpoint. - Malware Download: Malicious C2 payload retrieval linking
evil-payload-drop.orgto an executable SHA256 hash.
The Result:
- The Gin API receives and validates the events in
< 2ms, persisting raw records to PostgreSQL and publishing messages to RabbitMQ. - The Worker Daemon pulls the message, extracts all IOCs, runs GeoIP + VirusTotal enrichment, queries Redis, calculates the 5-factor risk score (
86.5/100), maps MITRE techniqueT1105, and persists threat relationships. - The Alert Engine identifies a risk threshold breach (
≥ 70) and generates a Critical Alert on the analyst dashboard in real time.
Key Engineering Lessons Learned
Building Vortex from scratch provided invaluable insights into designing high-throughput, secure backend systems:
- Decouple Ingestion from Processing Early: By offloading heavy threat enrichment (HTTP API latency, DNS resolution, graph traversal) to RabbitMQ background workers, the REST ingestion API maintains constant low latency regardless of external API response times.
- Explainability Builds Trust in Security: Complex mathematical models that expose their breakdown variables (
Reputation,Severity,Frequency,Confidence,Correlation) provide actionable value to analysts, whereas opaque scores create fatigue. - Type-Safe Database Access is Non-Negotiable: Using
sqlceliminates runtime SQL syntax surprises and provides compile-time guarantees that the database layer and Go structs remain perfectly synchronized. - Security Must Be Built-in, Not Bolted-on: Adding rate limiting, connection pooling, graceful shutdowns, and static vulnerability scanning from Day 0 prevents extensive refactoring later.
What's Next
Vortex is continuously evolving. Planned enhancements include:
- STIX 2.1 & TAXII 2.1 Feed Ingestion: Native consumption of open cyber threat feeds.
- OpenTelemetry & Prometheus Metrics: Instrumentation for Grafana dashboard observability.
- Suricata & Zeek Native Log Parsers: Direct ingestion of IDS/IPS PCAP telemetry logs.
- Role-Based Access Control (RBAC): Fine-grained multi-tenant analyst permissions using JWT & OIDC.
Get Involved & Check Out the Code
Vortex is open-source and licensed under Apache 2.0. Whether you are a Go engineer, SOC analyst, or DevSecOps enthusiast, contributions, feedback, and stars are warmly welcome!
- 💻 GitHub Repository: github.com/yehezkiel1086/vortex
- Connect with me on LinkedIn / GitHub: Let's talk about Go backend engineering, cloud architecture, and DevSecOps!
If you found this article helpful, give it a few claps and share it with fellow Go developers and security practitioners!